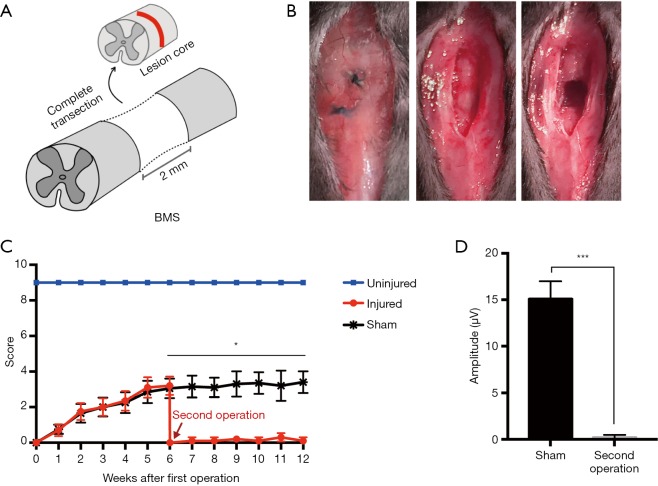
Figure 3.
Establishing the complete SCI complete transection model in the second operation. (A) A schematic illustration of the complete SCI transection model by transection at the T9 level, with the removal of a 2-mm spinal cord segment centered on the lesion. (B) The second surgical procedure: 6 weeks after the first operation, cut the skin again along the wound (the left panel). Separate tissues layer-by-layer to expose the injured spinal cord (the middle panel). Completely remove the 2-mm spinal segment from the center of the lesion (the right panel). (C) BMS open-field test shows hindlimb motor functional change until 12 weeks after the first operation. After the second operation, the hindlimb function decreased again to 0, and there was then no recovery. In the sham group, the spinal cord was re-exposed during the second operation without secondary injury (mean ± SD; *, P<0.05, n=6, unpaired Student’s t-test with the comparison between the sham and second operation groups at each time point). (D) MEP amplitude analysis of sham and second operation groups 6 weeks after the second injury (mean ± SD; ***, P<0.005, n=3, unpaired Student’s t-test). SCI, spinal cord injury; BMS, Basso Mouse Scale; MEP, motor evoked potential; SD, standard deviation.

