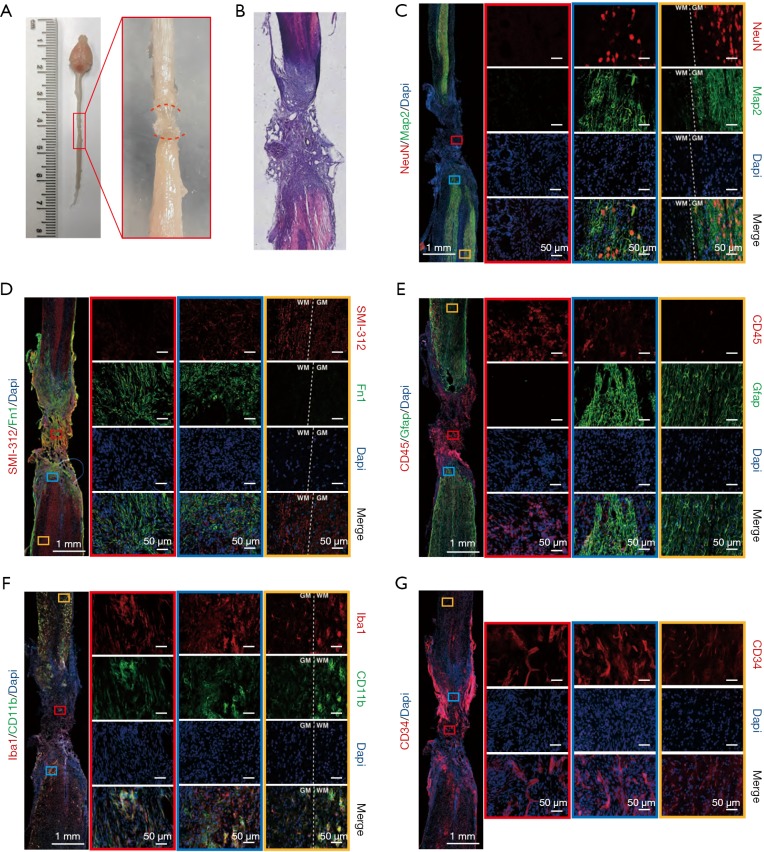
Figure 4.
Immunostaining revealed pathological features of the spinal cord after the second operation. (A) Dorsal view of the representative spinal cords 4 weeks after the second operation. The newly generated scar tissue fills the spinal cord lesion region (in red brackets). (B) HE staining of spinal cord tissue 6 weeks after the second operation. (C,D,E,F,G) Immunofluorescence staining of the various cell markers 4 weeks after second operation. Magnified images of lesion area (red box), the peripheral area of the lesion (blue box), and away from the lesion area (yellow box) are shown on the right. (C) Neuronal makers Map2 and NeuN; (D) pan axonal marker SMI-312 (neurofilament) and fibroblast marker fibronectin (Fn1); (E) astrocyte marker Gfap and pan-leukocyte surface marker CD45 (Ptprc); (F) microglia markers Iba1 and CD11b; (G) vascular marker CD34. WM, white matter. GM, gray matter; HE, hematoxylin and eosin; Map2, microtubule-associated protein 2; Gfap, glial fibrillary acidic protein; Ptprc, protein tyrosine phosphatase, receptor type C.

