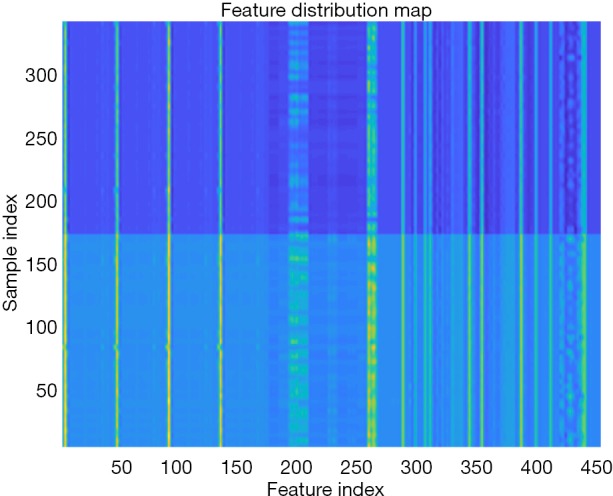
Figure 3.

Distribution of radiomics features between the two groups of patients. The x-axis shows the feature index, and the y-axis shows the sample (pulmonary nodule) index. Sample indices 1–171 are benign nodules, and 172–342 are malignant nodules. Different colors represent different categories of features. The feature distribution chart indicates that the extracted features are conducive to distinguishing benign and malignant lesions.
