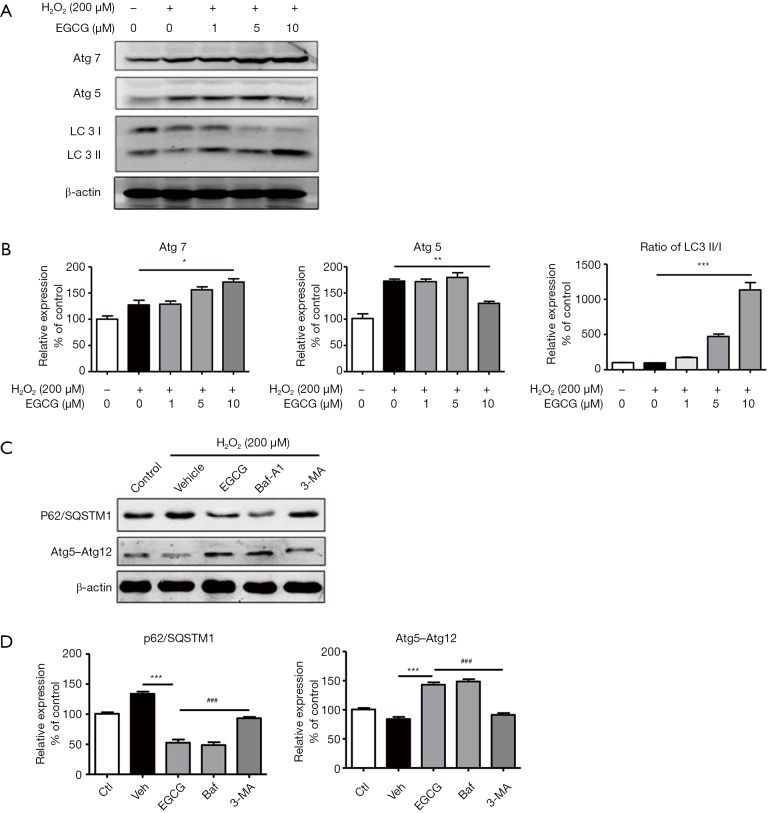
Figure 4.
EGCG regulated expression of autophagy-related marker proteins. (A) Western blot analysis of endogenous LC3, Atg5 and Atg7 after challenge with EGCG at different concentrations (1, 5, 10 µmol/L) for 24 h and H2O2 for 4 h. (B) Bar charts show the quantification of Atg7, Atg5 and endogenous LC3-II/I. n=3. *P<0.05, **P<0.01, ***P<0.001 vs. H2O2 alone group. (C) Western blot analysis of p62/SQSTM1 and Atg5–Atg12 complex after pretreated with EGCG (10 µmol/L) and with or without 3-MA in HUVECs following H2O2 for 4 h. (D) Bar charts show the quantification of p62/SQSTM1 and Atg5–Atg12 complex. Values are expressed as the mean ± SEM, n=3, ***P<0.001 vs. H2O2 alone group. ###P<0.001 vs. 3-MA pretreatment group.

