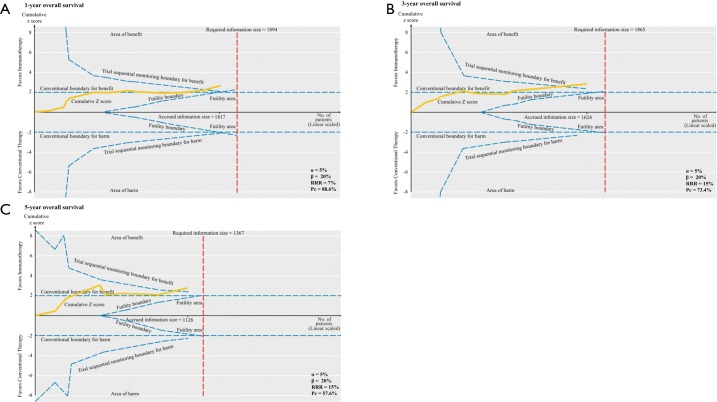
Figure S5.
Trial sequential analyses of trials comparing immunotherapy with conventional therapy. Trial sequential analyses for 1-year overall survival rate (A), 3-year overall survival rate (B), and 5-year overall survival rate (C). The solid yellow cumulative Z curves indicate the cumulative Z score obtained from the inverse variance model Z statistic when a new trial is added. The solid yellow cumulative Z curves cross the dashed blue trial sequential alpha for monitoring boundaries. The horizontal dotted blue lines illustrate the traditional level of statistical significance (P=0.05). Pc = event proportion in the conventional therapy group. RRR, relative risk reduction.

