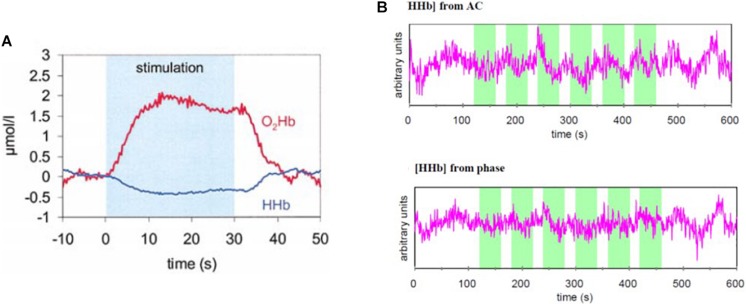
FIGURE 3.
Functional FD-NIRS on the human brain. (A) Hemodynamic response to visual stimulation (checkerboard reversing) measured in the human visual cortex with AC data at two wavelengths (758 and 830 nm) translated into concentration changes in oxyhemoglobin (O2Hb) and deoxyhemoglobin (HHb). (B) Deoxyhemoglobin concentration ([HHb]) traces obtained from AC data (top) and phase data (bottom) in the human prefrontal cortex in a protocol involving arithmetic calculations (indicated by the green shaded areas in the two panels. (A) Reprinted with permission from Wolf et al. (2002b) Elsevier; (B) Reprinted with permission from Toronov et al. (2001) The Optical Society of America.

