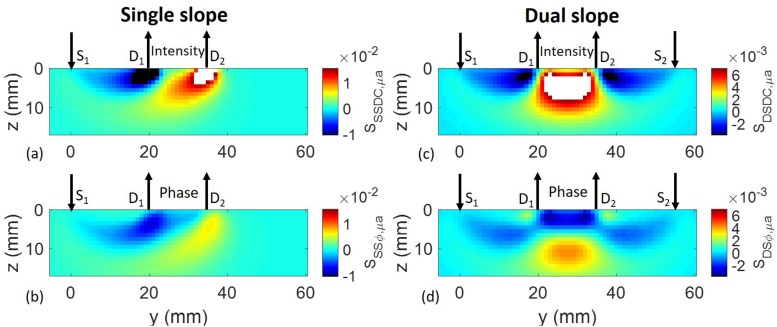
FIGURE 5.
Sensitivity maps for absorption contrast of (A) single-slope intensity, (B) single-slope phase, (C) dual-slope intensity, and (D) dual-slope phase. The arrows pointing down indicate the light sources (S1, S2), and the arrows pointing up indicate the optical detectors (D1, D2). The color bar labels in panels (A,C) indicate the sensitivity to absorption perturbations for single slope DC intensity (SSSDC,μa) and dual slope DC intensity (SDSDC,μa), respectively. The color bar labels in panels (B,D) indicate the sensitivity to absorption perturbations for single slope phase (SSSφ,μa) and dual slope phase (SDSφ,μa), respectively. White and black in the color maps indicate values greater than the maximum or smaller than the minimum, respectively, of the color bars. Adapted with permission from Sassaroli et al. (2019)© The Optical Society of America.

