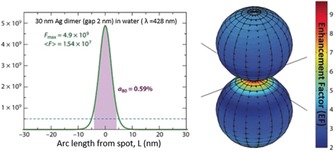
Figure 3.

Calculated enhancement factor (EF) distribution around the hot spot in a dimer of silver spheres (radius 30 nm, gap 2 nm). The excitation wavelength is taken at the dipolar localized surface plasmon resonance, which provides the maximum SERS EF. The logarithmic false color maps show graphically the surface SERS EF distribution in the |E|4 approximation. The plot on the left shows the SERS EF in the plane of incidence as a function of arc length L along the surface together with the maximum SERS EF (F max), the surface‐averaged SERS EF (⟨F⟩) and the relative area a80 from which 80 % of the total SERS signal originates. Figure adapted from Ref. 21.
