
Figure 2.
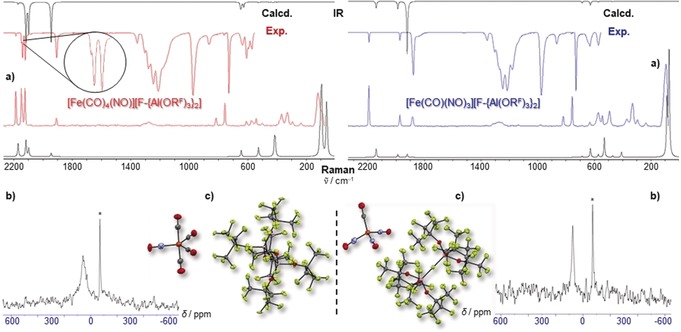
a) Experimental (Exp., red or blue) and calculated (Calcd, black, cations only, C 2v/C 3v symmetry @BP86def2/TZVPP‐D3BJ, no scaling factor was applied) vibrational spectra of 1 and 2, note the 2144 cm−1 shoulder in the expanded CO region of the IR spectrum of 1; b) 14N NMR‐spectra (21.69 MHz, oDFB, 298 K,), * signal from N2 atmosphere; c) molecular structures of 1 (P21/c, R1=4.2 %, wR2=11.9 %) and 2 (P‐1, R1=4.3 %, wR2=10.7 %). Note that the NO ligands are crystallographically indistinguishable from CO and were only colorized for visual purposes; thermal ellipsoids set at 50 % probability.