Figure 2.

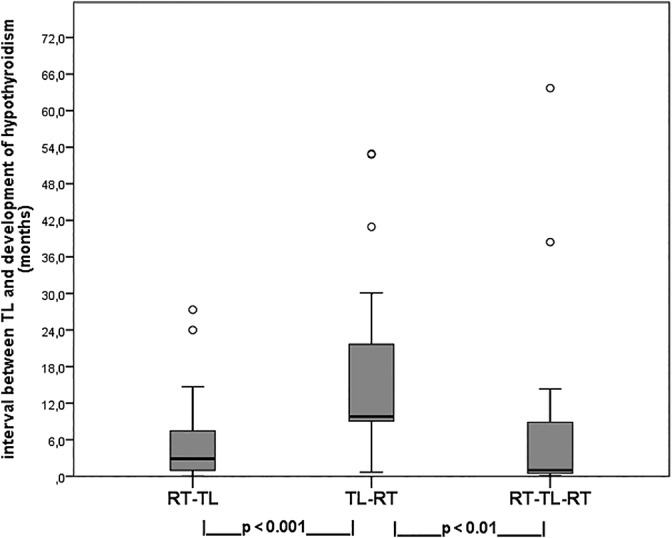
Boxplots of interval (in months) between TL and development of hypothyroidism in 69 patients in relation to the three treatment regimens (statistical analysis by Mann‐Whitney U test)

Boxplots of interval (in months) between TL and development of hypothyroidism in 69 patients in relation to the three treatment regimens (statistical analysis by Mann‐Whitney U test)