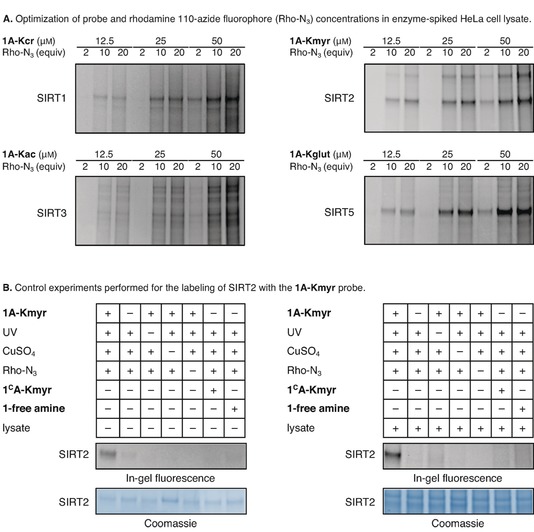
Figure 2.

Optimization of covalent adduct formation and control experiments applying in‐gel fluorescence: (A) Optimization of probe concentration and probe‐fluorophore ratio required for labeling of SIRT1‐3 and SIRT5 (1 μM enzyme concentrations). (B) Control experiments shown for 1A‐Kmyr (12.5 μM) showing that labeling is indeed dependent on all components added. See the Supporting Information for full gel images (Figures S3–S5).
