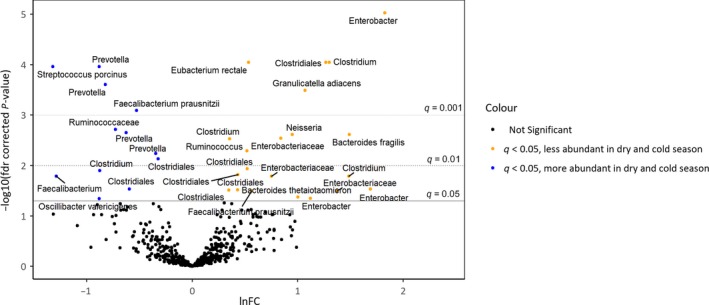
Figure 3.

Differences in OTU abundances at 30 mo between samples collected in the dry and cold season and samples collected in the dry and hot or rainy seasons. Results from zero‐inflated negative binominal model adjusted for other environmental predictor variables and covariates. The dots represent OTUs arranged according to ln fold change (lnFC) in OTU abundance between samples collected in different seasons and the corresponding fdr‐corrected P‐values. Positive lnFC values represent OTUs that are less abundant in samples collected in the dry and cold season compared with the dry and hot and rainy seasons. Differences in OTUs in orange and blue above the solid line were significant at level q = 0.05 [Colour figure can be viewed at http://wileyonlinelibrary.com]
