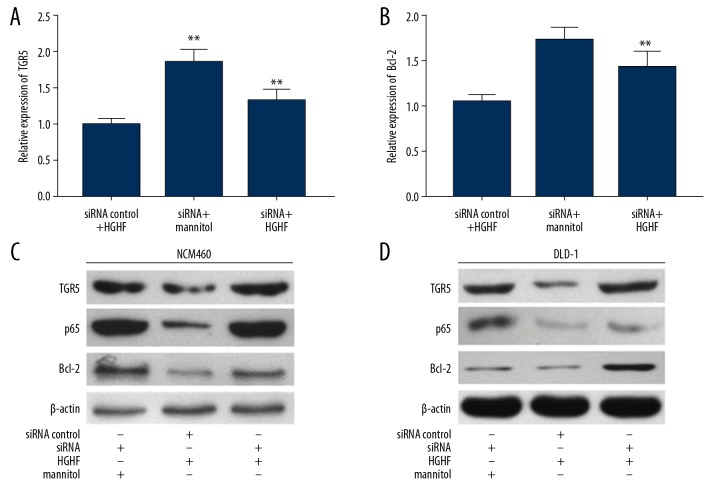
Figure 5.
Inhibition of SNHG5 reduced TGR5 expression. (A) Real-time PCR showed changes in siRNA on TGR5 levels under high-glucose and high-fat conditions in NCM460 cells. (B) The expression of Bcl-2 was changed by siRNA of SNHG5 in NCM460 cells. Western blot analysis showed that TGR5, p65, and Bcl-2 levels were returned according to siRNA with high-glucose and high-fat in NCM460 cells (C) and DLD-1 cells (D). Data are shown as means±SD (* P<0.05/** P<0.01 vs. SiRNA control+HGHF or siRNA+mannitol). HGHF – high-glucose and high-fat.

