Figure 1.

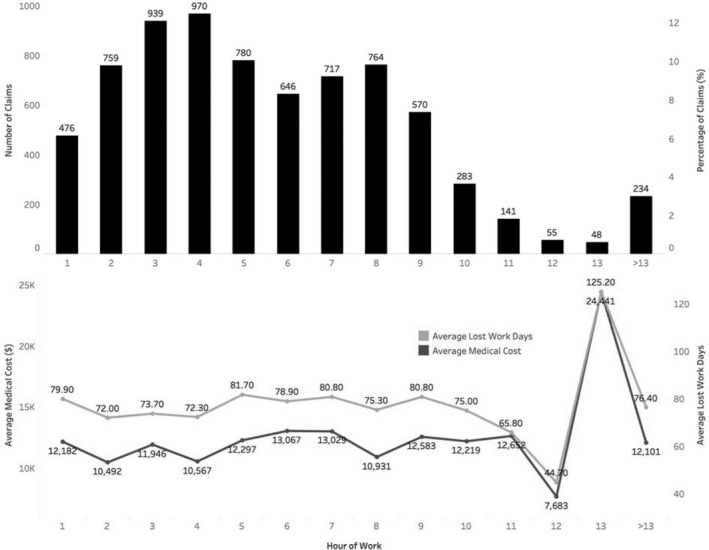
Workers’ compensation accepted disabling claims frequency and percentage, average compensated medical cost, and average lost work days by hour of work, Oregon construction industry, 2007‐2013

Workers’ compensation accepted disabling claims frequency and percentage, average compensated medical cost, and average lost work days by hour of work, Oregon construction industry, 2007‐2013