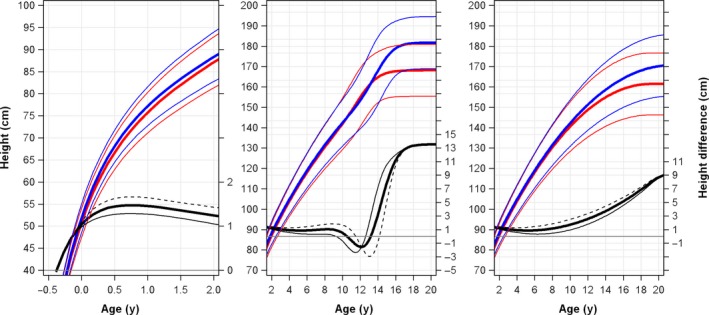
Figure 1.

New 1990 references for total height and prepubertal height in girls and boys. References for total height generated based on the Q, E, P and S functions (left and middle panels) and for prepubertal height based on the Q and E functions of the QEPS model (right panel). Values shown are mean ± 2SDS for girls (red) and boys (blue) of different ages. The difference in mean height gained (thick solid black line), +2SDS (thin solid black line) and −2SDS (dotted black line) for boys relative to girls is shown at the bottom of each graph. The 1990‐born population used to generate the reference is described in Table 1. For numerical values, for total height reference see Table S4 and for prepubertal height reference see Table S5
