
Figure 2.
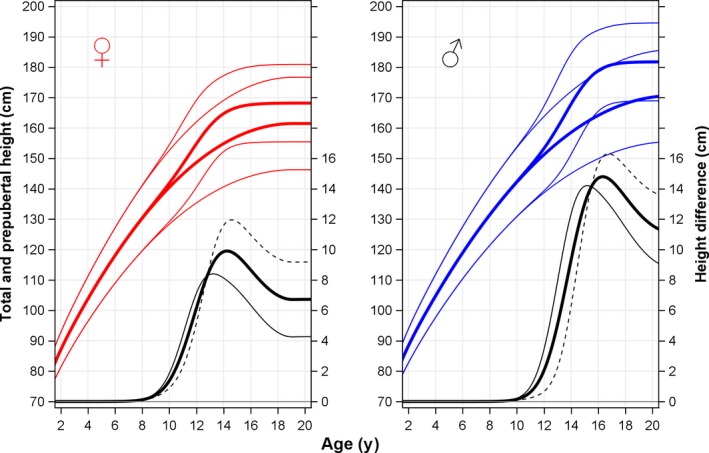
Difference between total and prepubertal height references in girls and boys. References for total height generated based on the Q, E, P and S functions (upper curves) and for prepubertal height based on the Q and E functions of the QEPS model (lower curves). Total height values shown are mean ± 2SDS for girls (in red, left) and boys (in blue, right). The difference in height between the total and the prepubertal reference values for children growing along the mean (thick solid black line), along +2SDS (thin solid black line) and along −2SDS (dotted black line), is shown at the bottom of each graph. The population used to generate the references is described in Table 1. For girls (Figure 2, left), the maximum difference in height between the two references was found at 14.2 y of age for those growing along the mean (difference of 9.9cm), at 13.3 y for girls growing along + 2SDS (difference of 8.4cm), and at 14.6 y for girls growing along −2SDS (difference of 12 cm). The corresponding maximum height differences for boys (Figure 2, right) were found at 16.4 y of age for those growing along the mean (difference to be of 14.8 cm), at 15.3 y of age for those growing at + 2SDS (difference of 14.2 cm), and at 16.8 y of age for those growing at −2SDS (difference of 16.3 cm)