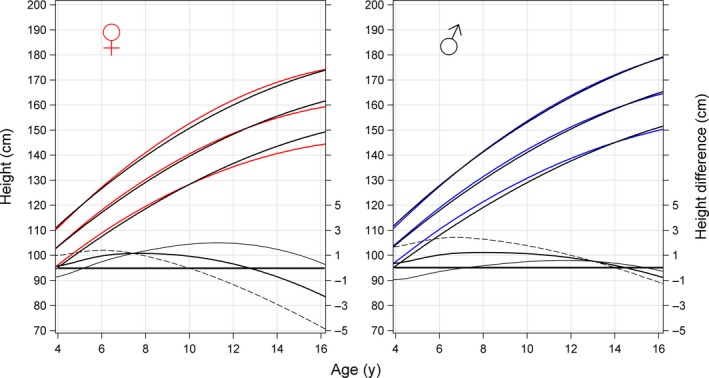
Figure 3.

Comparison between the new 1990 prepubertal reference and the 1974 prepubertal reference. Comparison between the new 1990 prepubertal height reference population for girls (red, to the left) and boys (blue, to the right) for mean and ± 2SDS and the 1974 prepubertal reference population (black) in relation to chronological age (y). The right Y‐axis display the corresponding differences between 1990 and 1974 (mean = bold black lines, −2SDS = thin black lines and + 2SDS = broken black lines); zero lines for difference are indicated with a black horizontal line)
