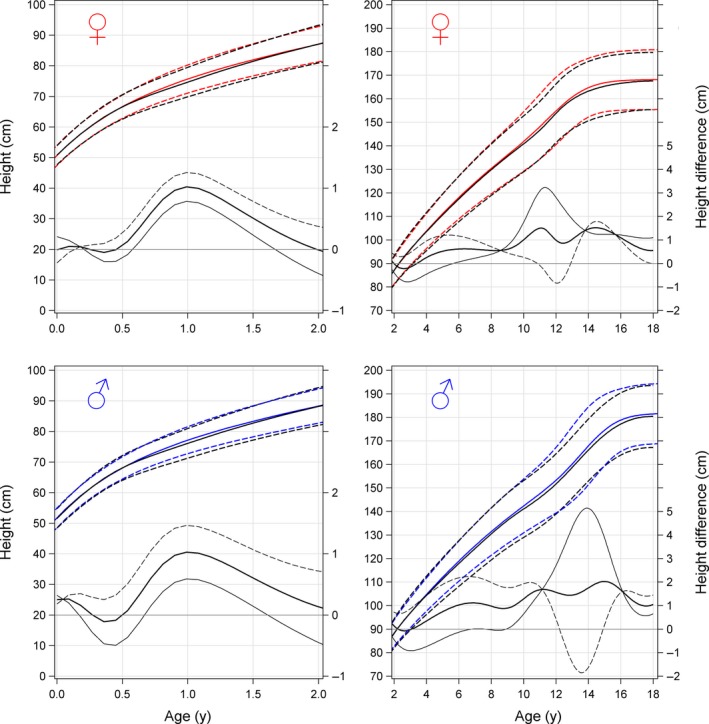
Figure 4.

Comparison between the new 1990 reference and the 1974 reference. Comparison between the new 1990 population reference (red/blue) and the 1974 reference used for the growth charts (black).7, 21 Total height is shown in the top panel for girls and in the bottom panel for boys; references for children aged 0‐2 y and 2‐18 y are shown on the left and right panel, respectively. The difference between the total heights obtained using the two references is shown in the bottom panel of each figure. Differences in mean (thick solid black line), in +2SDS (thin solid black line) and in −2SDS (dotted black line) are shown. Visual inspection of data before puberty shows a maximal difference in attained height at −2SDS of 2 cm for boys and 1cm for girls; the corresponding values for the means are 0.5 cm and 1 cm, respectively. For interpretation of difference in normal range (within ± 2SDS): if the dotted thin line for the −2SDS difference is above the thin solid line for the +2SDS difference, the range for ± 2SDS is narrower for the new 1990 reference than for the 1974 all healthy population; as seen, this is the case for both boys and girls at most ages
