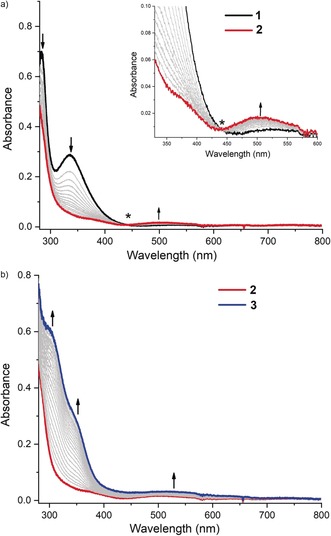
Figure 5.

UV/Vis (spectro)electrochemistry showing the continuous oxidation of a) 1 to 2 (at 0.8 V vs. Ag wire; 1 (black), 2 (red); the inset shows a magnified view of the 330–600 nm range) and b) from 2 to 3 (at 1.5 V vs. Ag wire; 2 (red), 3 (blue)) in an MeCN solution containing 0.1 m [nBu4N][PF6]. The isosbestic point is marked with an asterisk.
