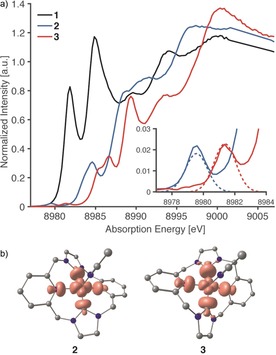
Figure 9.

a) Cu Kβ HERFD‐XAS of 1–3 (up, solid lines). Inset: TD‐DFT‐calculated pre‐edge spectra of 2 and 3 (dashed lines). Each calculated pre‐edge consists of a single transition, broadened by 1.4 eV (FWHM). b) The transition difference density plots for each pre‐edge transition of 2 and 3 (bottom) are shown with isodensity value=0.003 au. Color code: C (gray), N (blue), Cu (red), hydrogen atoms omitted. Calculations shifted by +188.55 eV.
