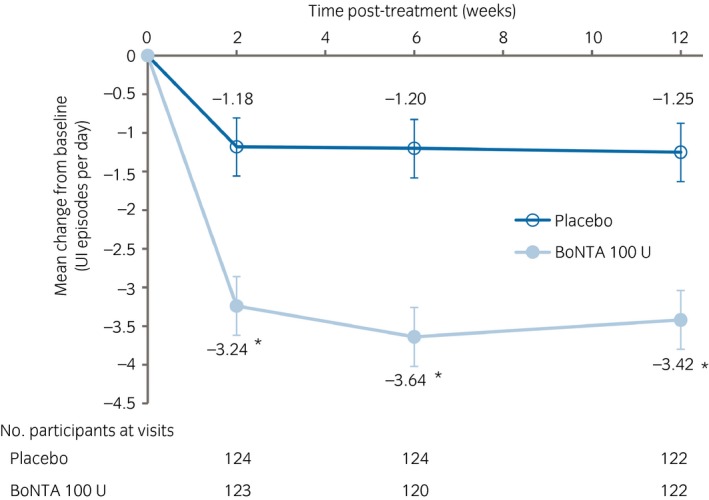
Figure 3.

Change from baseline in the mean number of daily UI episodes. Values: adjusted mean; error bars: SE. *P < 0.001 versus placebo. The data were analyzed using a MMRM with treatment, site, visit, treatment‐by‐visit interaction, baseline value and baseline‐by‐visit interaction as fixed effects.
