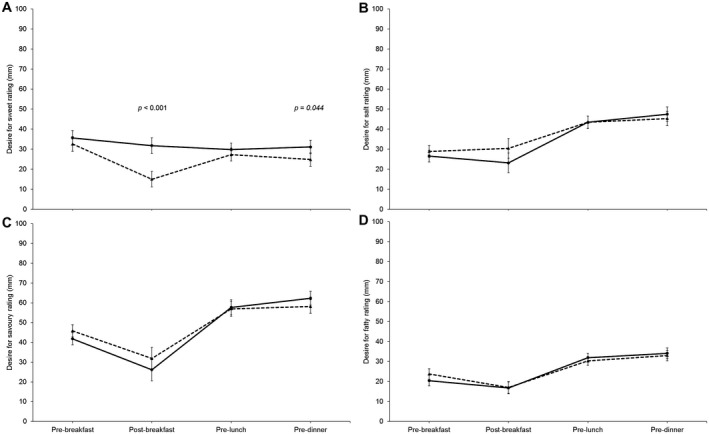
Figure 4.

Visual analogue scale ratings for desire for (A) sweet, (B) salty, (C) savory, and (D) fatty across the day (n = 29). Dashed lines are “Sweet,” and full lines are “Plain.” Error bars: normalized confidence intervals. P values represent comparison of Plain vs. Sweet for that time point and are adjusted (Bonferroni) for multiple comparisons. Only significant P values are shown.
