
Figure 7.
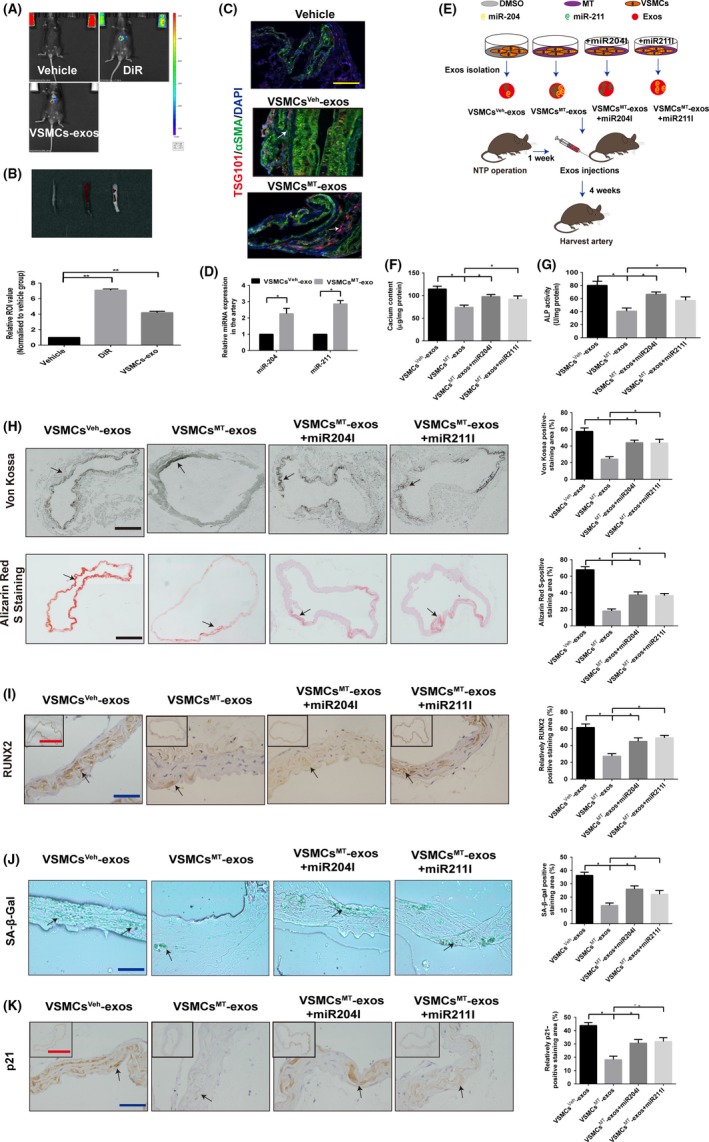
Exosomal miR‐204/miR‐211 contributes to the inhibition effects of VSMCsMT‐exos on vascular calcification and ageing in a 5/6 NTP mouse model. A, The 5/6 NTP‐induced mice were subjected to vehicle (sterile PBS), DiR or DiR‐labelled VSMC‐derived exosomes (VSMCs‐exos) intravenously (100 μg/mice, n = 5 per group). Representative in vivo images of mice (A) and ex vivo images of thoracic aorta (B, upper panel), as well as quantification of fluorescence intensities in thoracic aorta (B, lower panel), are shown after treatment for 24 h. (C and D) Exosomes from MT‐treated VSMCs (VSMCsMT‐exos, 100 μg/mice) or vehicle‐treated VSMCs (VSMCsVeh‐exos, 100 μg/mice) were injected intravenously every 3 d for 4 wk in 5/6 NTP mice (n = 5 per group). C, Representative confocal fluorescence images of exosome marker TSG101 (red fluorescence) and smooth muscle marker αSMA (green fluorescence) in thoracic aorta sections are shown. Scare bar represents 50 µm (yellow). D, Relative expression of miR‐204 and miR‐211 in the artery was detected by qRT‐PCR. E, Schematic flow diagram of injections of exosomes with or without miR‐204 and miR‐211 in 5/6 NTP‐induced mice (n = 5 per group). F, Calcium content of thoracic aorta of mice was measured by o‐cresolphthalein complexone method. G, The ALP activity of thoracic aortic tissues normalised to total proteins contents. H, Von Kossa‐stained and Alizarin Red S‐stained sections from thoracic aorta (left panel) and quantitation of positive staining area (right panel) are shown. Scare bar 200 µm (Black). I, Immunohistochemistry analysis of RUNX2 in thoracic aorta (left panel) and quantitation of positive staining area (right panel) are shown. Scare bar 50 µm (Blue) and 500 µm (Red). J, SA‐β‐gal‐stained (Green) micrographs are presented (left panel), and quantitation of positive staining area (right panel) is shown. Scare bar 50 µm (Blue). Green staining area indicates ageing tissues. K, Immunohistochemistry analysis of the expression of p21 in thoracic aorta (left panel) and quantitation of positive staining area (right panel) are shown. Scare bar 50 µm (Blue) and 500 µm (Red). Results are represented by mean ± SEM with five replicates for each group. Significance was analysed by two‐way ANOVA with Tukey's HSD post hoc analysis.*P < .05