
Figure 3.
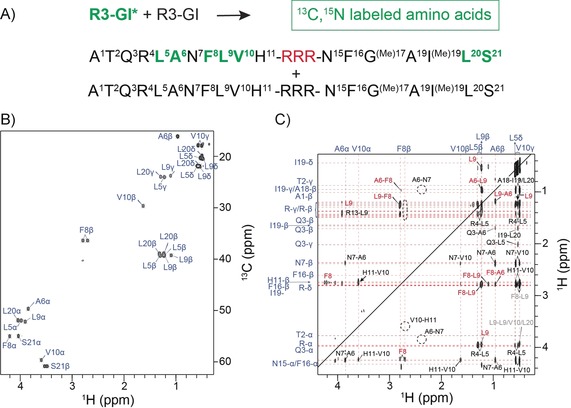
Identification of intermolecular NOEs for R3‐GI. A) Amino acid sequence and labeling scheme for R3‐GI. Residues labeled in green are uniformly enriched with 13C and 15N. For the NMR experiment, labeled and non‐labeled peptide was mixed in a 1:1 ratio. B) 1H,13C correlation spectrum of R3‐GI*. C) 1H (ω1),1H (ω3) correlation spectrum extracted from the 3D NOESY experiment. During ω1, protons were selected that are directly bonded to 12C, whereas 13C‐bound protons were filtered during ω3. In addition to trivial sequential connectivities (e.g., H11β–V10α) that appear only on one side of the diagonal, a number of symmetric cross‐peaks (in red) were observed that are due to intermolecular interactions.