
Figure 6.
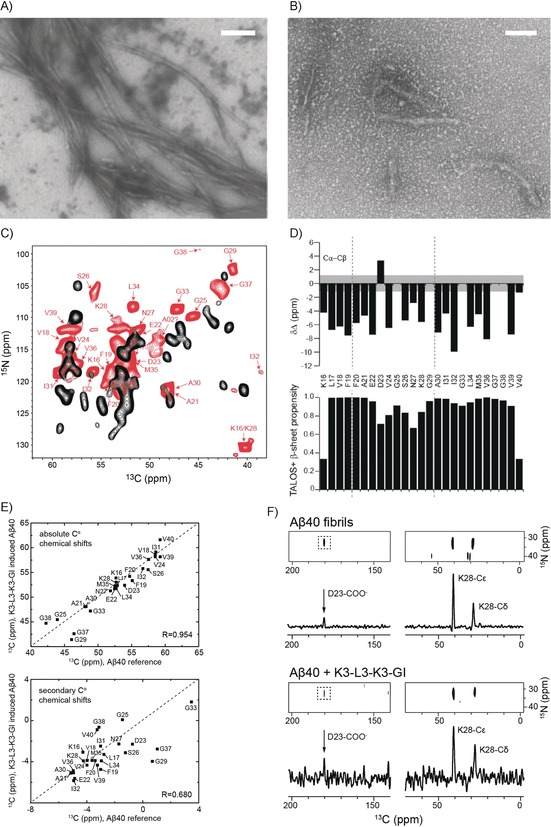
Structural characterization of K3‐L3‐K3‐GI‐induced Aβ40 aggregates. A, B) TEM images of Aβ40 in the absence (A) and presence (B) of an equimolar amount of K3‐L3‐K3‐GI. Scale bar: 200 nm. C) 2D 13C,15N MAS solid‐state NMR correlation spectra obtained for K3‐L3‐K3‐GI‐induced Aβ40 aggregates (red). To prepare the sample, a 20 μm solution of monomeric Aβ40 was incubated with a 1.23‐fold molar excess of K3‐L3‐K3‐GI. For reference, the correlation spectrum obtained for Aβ40 fibrils is shown in black. To prepare the Aβ40 fibril sample, monomeric Aβ40 was grown using 5 % seeds, following the protocol described by Lopez and co‐workers.17 (D) Cα–Cβ chemical shift differences for K3‐L3‐K3‐GI‐induced Aβ40 aggregates (top). TALOS+[19]‐predicted secondary structure propensity (bottom). E) Correlation of the NMR chemical shifts observed for K3‐L3‐K3‐GI‐induced Aβ aggregates and Aβ fibrils. On top and bottom, correlations for the absolute and secondary Cα chemical shifts are shown. Secondary Cα chemical shifts indicate differences from random‐coil chemical shifts. The correlation coefficient is on the order of R=0.954 and R=0.680, respectively. The correlation coefficient is very high, indicating that the conformation in the two different preparations is surprisingly similar. F) 2D 13C,15N TEDOR MAS solid‐state NMR spectra for Aβ40 fibrils (top) and K3‐L3‐K3‐GI‐induced Aβ40 aggregates (bottom). Only the spectral region containing amino side chain nitrogen chemical shifts is shown. For both samples, a long‐range correlation peak between Nϵ of Lys‐28 and the carboxylic carbon atom of Asp‐23 is observed, indicating that a salt bridge is formed in the K3‐L3‐K3‐GI‐induced Aβ40 aggregates. The relative intensity of the long‐range NH3–COO− cross peak appears to be larger in the K3‐L3‐K3‐GI/Aβ40 sample, indicating that this structure is presumably more compact.