
Figure 2.
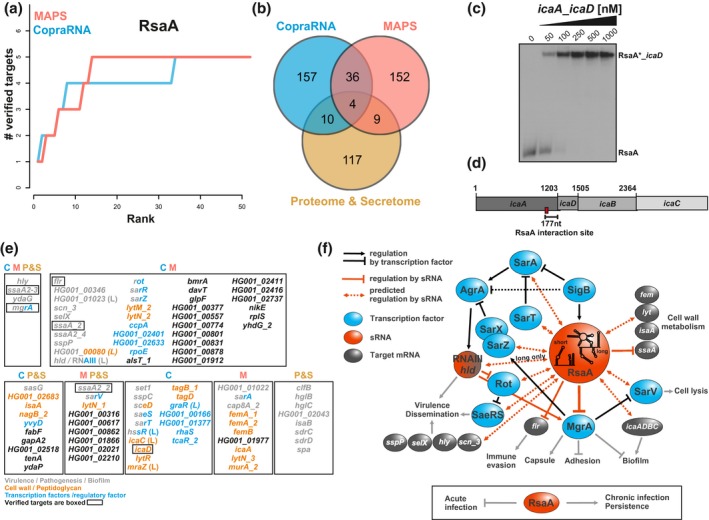
Integration of MAPS, CopraRNA, and proteomic data to estimate the RsaA targetome. The MAPS and proteomic data were taken from reference (Tomasini et al., 2017). (a) The cumulated numbers of known targets are plotted against the prediction rank for CopraRNA and MAPS as an estimate of sensitivity and specificity. (b) The Venn diagram shows the overlap of the top 200 MAPS and CopraRNA predictions and the proteins, which were significantly differentially synthesized in the proteome and secretome data. (c) Gel retardation assays using the short version of RsaA and a putative mRNA target. 5′end‐radiolabeled RsaA(*) was incubated with increasing concentrations of icaA_icaD fragment (nts −239 to +175, from the AUG of icaD). (d) Schematic visualization of the icaADBC operon and the location of the verified interaction site with RsaA. (e) Gene names or locus tags of the genes that were detected by more than one method or targets that are unique to one method but belong to one of the indicated functional categories. Genes in black characters encode hypothetical proteins or proteins with functions unrelated to the major targets of RsaA. C is for CopraRNA, M for MAPS, P for proteome, and S for secretome. (f) Schematic drawing of the regulatory networks involving RsaA. The experimental data are taken from Romilly et al. (2014) and Tomasini et al. (2017). Black arrows (activation) or bars (repression) are for transcriptional control, red arrows (activation) or bars (repression) are for post‐transcriptional control. Transcriptional regulators are in blue, regulatory RNAs are in red and other mRNAs regulated by RsaA are in grey. Dashed arrows are for potential RsaA targets for which experimental validation is required