
Figure 4.
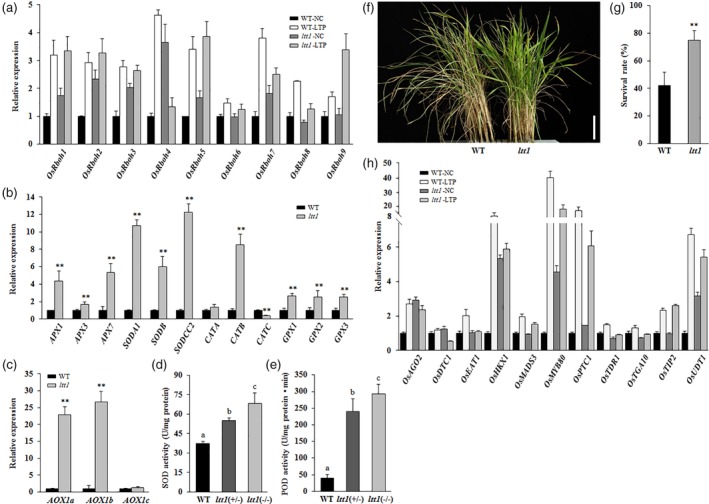
ltt1 shows differential expression of reactive oxygen species (ROS) homeostasis genes and tapetal programmed cell death genes. (a–c) Expression analysis of genes involved in ROS production and ROS scavenging. (a) Anthers at Stage 9 were collected from plants grown under NC and LTP. (b,c) Newly opened leaves were sampled from 50‐day‐old plants grown under natural conditions. The transcript levels were normalized against WT‐NC (a) and WT (b,c), which were set to 1. Data are means ± SD (n = 3). **p < .01 (Student's t‐test). (d,e) Enzyme activity quantification. Newly opened leaves of 60‐day‐old plants under natural conditions were sampled for analysis. Data are means ± SD (n = 3). Bars followed by different letters indicate significant difference at 5%. (f,g) ltt1 displays oxidative stress tolerance. Seedlings that are 30 days old were treated with 80‐mM H2O2 for 10 days. Data are means ± SD (n = 3). Bar = 5 cm. **p < .01 (Student's t‐test). (h) Expression analysis of tapetal programmed cell death genes. Anthers at Stage 9 were collected from plants grown under NC and LTP. The transcript levels were normalized against WT‐NC, which was set to 1. Data are means ± SD (n = 3). LTP, low temperature under phytotron conditions; NC, normal conditions; WT, wild type [Color figure can be viewed at https://wileyonlinelibrary.com]