Figure 8.

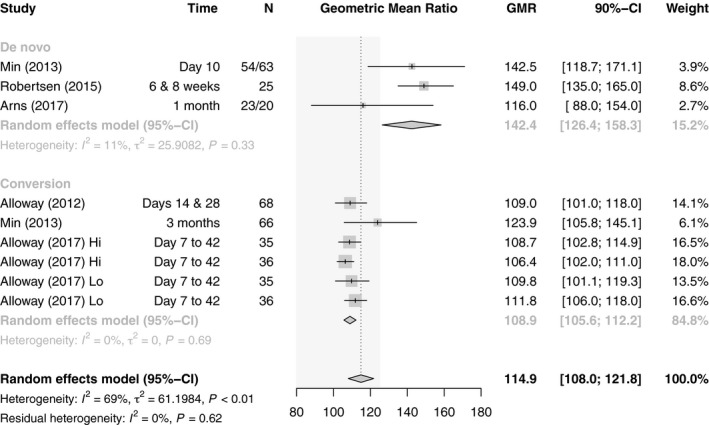
Forest plot of studies comparing geometric mean ratio of C max between generic and innovator tacrolimus – stratified by use. The EMA bioequivalence acceptance interval of 80.00–125.00 is displayed shaded in gray.

Forest plot of studies comparing geometric mean ratio of C max between generic and innovator tacrolimus – stratified by use. The EMA bioequivalence acceptance interval of 80.00–125.00 is displayed shaded in gray.