
Figure 4.
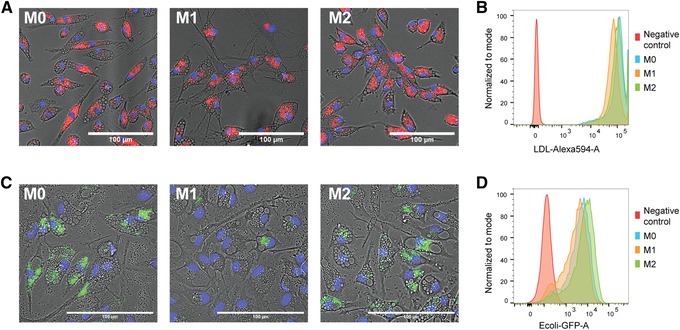
Endocytosis and phagocytosis of bacteria by iPSDMs. (A) Representative images of the AcLDL‐Alexa Fluor 594 uptake assay by different subtypes of iPSDMs. AcLDL positive uptake is shown in red; cell nuclei are stained with Hoechst in blue. Scale bar represents 100 μm. (B) FACS analysis of AcLDL‐Alexa Fluor 594 median fluorescence intensity of different macrophage subtypes. M0 macrophages only are included as negative control. (C) Representative images of bacterial phagocytosis by different subtypes of iPSDMs. Nuclei were stained with Hoechst in blue. GFP‐labeled (pHrodo green) E. coli were pH sensitive and only show green fluorescence inside macrophages. Scale bar represents 100 μm. (D) FACS analysis of E. coli‐GFP median fluorescence intensities in macrophage subtypes. M0 macrophages only are included as negative control. Abbreviations: iPSDMs, hiPSC‐derived macrophages; AcLDL, acetylated low‐density lipoprotein; FACS, fluorescence activated cell sorting; GFP, green fluorescent protein.