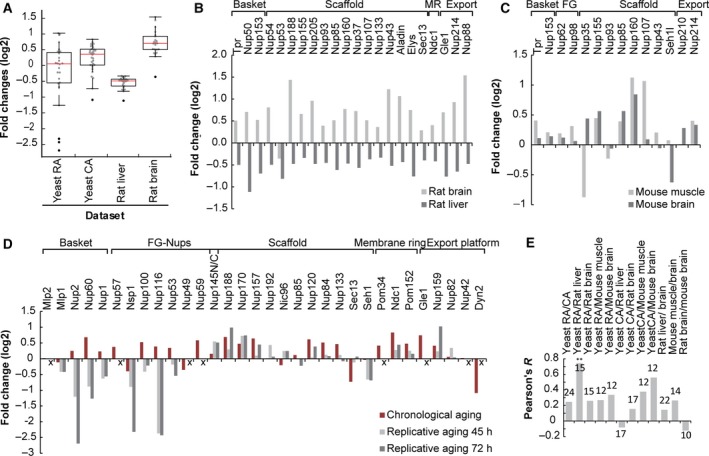
Figure 3.

Loss of overall NPC stoichiometry in different aging model systems: budding yeast 2, 40, rat 3, and mouse 41. (A) Fold changes in abundance of Nups from different aging proteome data sets, comparing the changes in aged mice and rats (24 months, 50–70% viability) and replicative aging yeast (Yeast RA; 72 h, 55% viability) and chronological aging yeast (Yeast CA; 60% viability). Fold changes of individual Nups from each dataset are plotted as gray dots and are overlaid with a boxplot. 24, 32, 22, and 22 Nups were measured in the yeast RA, yeast CA, rate liver, and rat brain samples, respectively. The red line depicts the median fold change and the boundaries of the box mark the 25th and 75th percentile of fold changes in the dataset. The height of the box (IQR) is influenced by the spread within the middle 50% of the data and is a robust measure of dispersion, that is, insensitive to outliers. The whiskers extend to the data points which are not considered outliers, which are shown as black dots. (B) Comparison of age‐related changes in Nup abundance of rat brain and rat liver. None of the individual changes were reported significant according to the criteria of the authors 3. (C) Comparison of age‐related changes in Nup abundance of mouse muscle and mouse brain. Only the change in Nup107 in muscle was reported significant according to the criteria of the authors 41. (D) Comparison of age‐related changes in Nup abundance of yeast chronological at a time point of ~ 60% population viability and yeast replicative aging at time points representing ~ 75 and 55% viability (45 h and 72 h). The replicative aging proteome does not include information on the abundance of Mlp2, Nup57, Nup49, Nup59, Gle1, Nup42, and Dyn2, represented by an ‘x’ on the x‐axes. In the chronological aging datasets, the changes for Nsp1, Pom152, Ndc1, Nup57, Nup170, Nup188, Nup60 Nup157, Sec13, Dyn2, Nup60 were reported significant according to the criteria of the authors 40; the data for the first replicate are shown. For the replicative aging dataset, no fold change statistics were reported but rather a noise threshold was applied to the time series datasets using the coefficient of variation between replicates with a cutoff of 0.3, retaining only the most reproducible data 2. The pronounced decrease in abundance of Sec13 and Dyn2 during chronological aging may not reflect changes at the NPC but rather reflect their roles cell division 61, 62. (E) Pearson correlations of pairwise comparisons of changes in Nup abundances in samples from different aging proteomes. The number on top of the bars indicates the sample size of Nups that were used for the comparison. ** indicates a significant correlation with P < 0.01. The correlation coefficient ranges from −1 to 1. Values close to −1 indicate negative, and values close to 1 indicate positive linear relationships between two samples. Values close to 0 indicate that there is no linear relationship between two samples.
