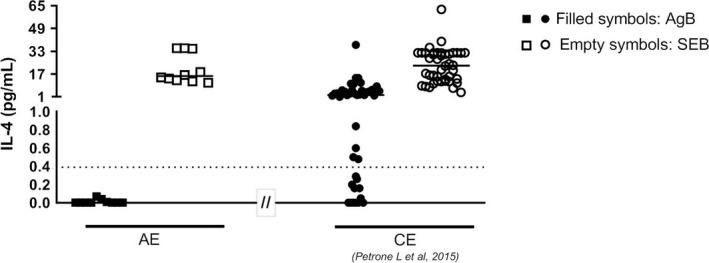
Figure 2.

Analysis of whole‐blood IL‐4 test. Patient with AE have negative results on the whole‐blood IL‐4 test. AE patients (squares) showed low or no IL‐4 levels in response to AgB‐enriched fraction (filled squares) compared with CE patients (filled circles) previously evaluated in Petrone et al12 AE patients (squares) showed similar IL‐4 levels in response to the SEB‐positive control (empty squares) compared with CE patients (empty circles) previously evaluated in Petrone et al12 Horizontal bars represent medians. IL‐4 concentrations were determined by ELISA. Cut‐off = 0.39 pg/mL determined in Petrone et al12. AE: alveolar echinococcosis; CE: cystic echinococcosis; AgB: antigen B; SEB: staphylococcus enterotoxin B: IL: interleukin
