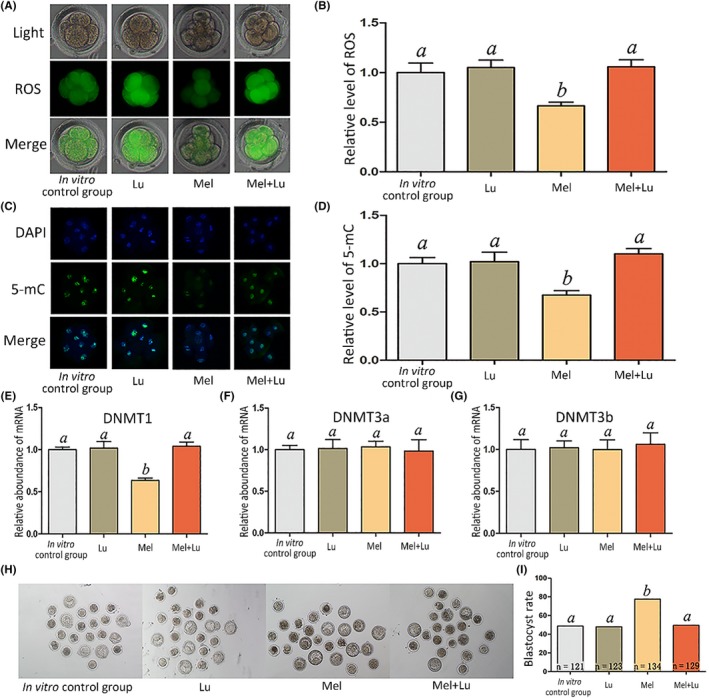
Figure 3.

Relative level of ROS and 5‐mC, and epigenetic‐related genes expression at the 8‐cell stage, and blastocyst rate. The treatment dose of melatonin and luzindole was 343.0 and 420.0 ng/mL, respectively. A, ROS staining in embryos. Upper panel: bright field; middle panel: green indicating ROS; lower panel: merged bright field and green fluorescence. B, Quantification of ROS fluorescence intensity. C, Staining pattern for 5‐mC in embryos. Green: 5‐mC; blue: DNA. D, Relative fluorescence intensity. E‐G, Relative mRNA expression levels of DNMT1, DNMT3a, and DNMT3b. H, Representative photographs of embryos on day 3. I, Blastocyst rate on day 3. Different letters above the bars indicate significant differences (P < .05). Mel, melatonin; Lu, luzindole
