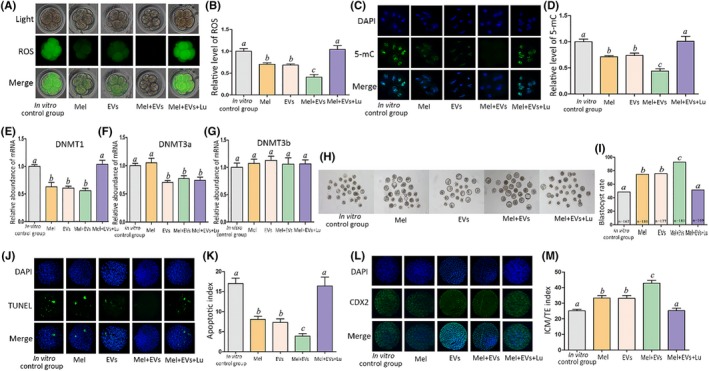
Figure 6.

Effect of the EVs and melatonin combination treatment on relative ROS and 5‐mC levels and epigenetic‐related gene expression at the 8‐cell stage as well as blastocyst rate, apoptosis index, and ICM/TE index. The groups were in vitro control group, melatonin group (343.0 ng/mL), EVs (1.87 × 10¹¹ particles/mL) group, EVs (1.87 × 10¹⁰ particles/mL) + Mel (34.3 pg/mL) group, and EVs (1.87 × 10¹⁰ particles/mL) + Mel (34.3 pg/mL) + Lu (420.0 ng/mL) group. A, ROS staining in embryos. Upper panel: bright field; middle panel: green fluorescence indicating ROS; lower panel: merged bright field and green fluorescence. B, Quantification of ROS fluorescence intensity. C, Staining pattern for 5‐mC in embryo. Green: 5‐mC; blue: DNA. D, Relative fluorescence intensity. E‐G, Relative mRNA expression levels of DNMT1, DNMT3a, and DNMT3b. H, Representative photographs of embryos on day 3. I, Blastocyst rate on day 3. J, TUNEL assay of apoptotic blastomeres. DAPI (blue): DNA. K, Apoptosis index of blastocysts. L, Immunostaining for TE (CDX2 antibody, green) and blastomeres (DAPI, blue). M, ICM/TE index of blastocysts. Different letters above the bars indicate significant differences (P < .05). EVs, extracellular vesicles; Lu, luzindole; Mel, melatonin; ICM, inner cell mass; TE, trophectoderm
