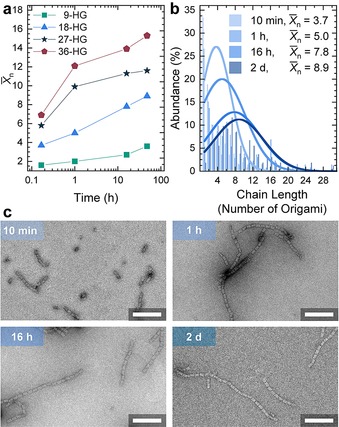
Figure 3.

Temporal development of the fibril length depending on the functionalization degree. Origami concentration is 20 nm. a) Temporal evolution of X̄n for the 4 different host/guest origami. b) Number fraction of species (abundance) in percent for 18‐HG origami in dependence of the assembly time. c) TEM images for 18‐HG origami cuboids after the indicated times. Scale bars 250 nm.
