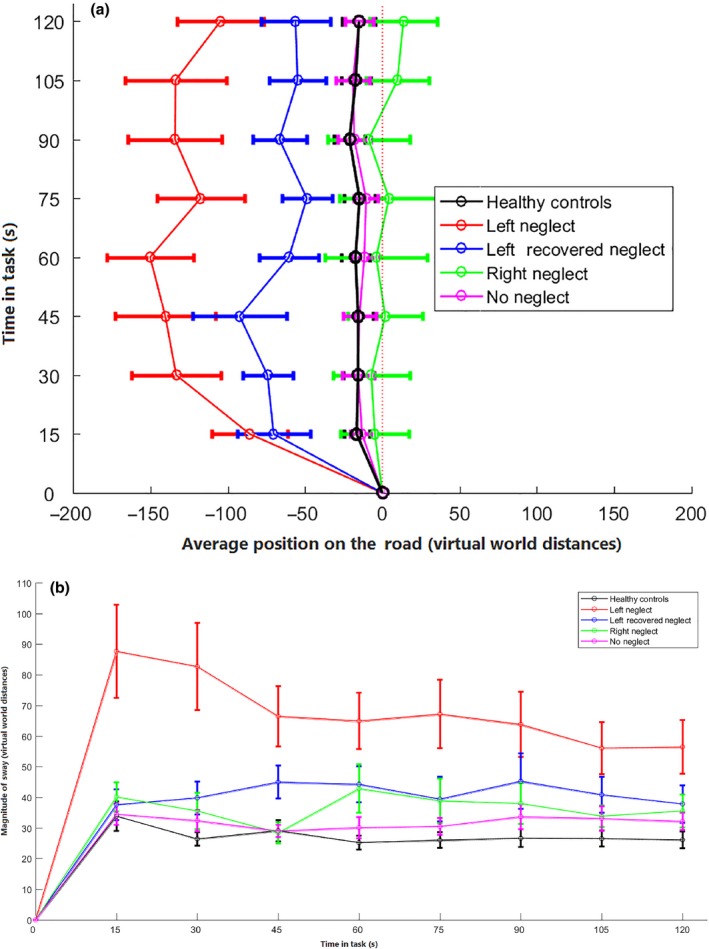
Figure 2.

Overview of the (a) average position on the road and (b) average magnitude of sway for left‐sided VSN+, right‐sided VSN+, left‐sided R‐VSN, VSN− patients, and healthy control participants. The horizontal error bars represent the variability (SD) in the average position or sway. With regard to Figure 2a, the dashed line represents the starting position at the centre of the right lane. [Color figure can be viewed at http://wileyonlinelibrary.com]
