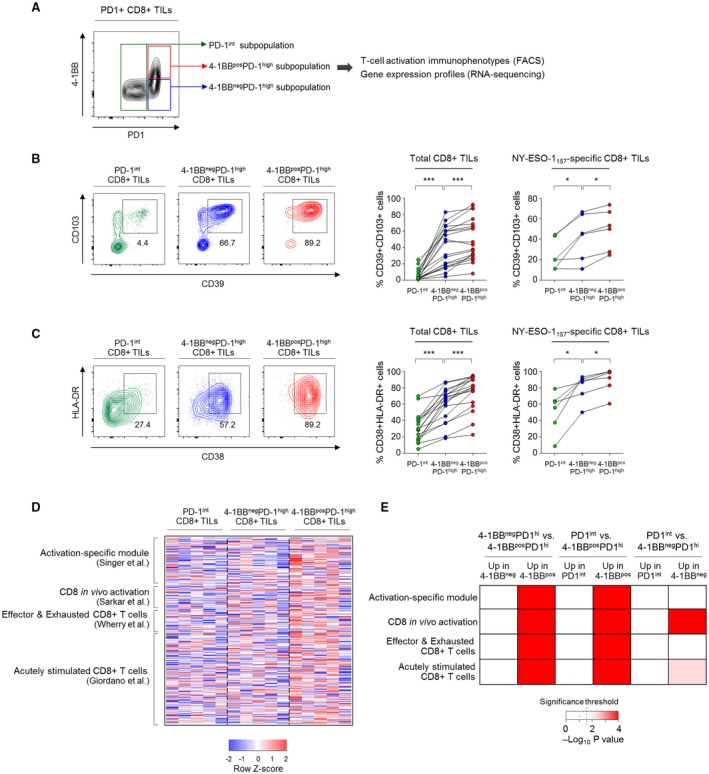
Figure 2.

4‐1BB–expressing PD‐1high CD8+ TILs feature immunophenotypically and transcriptionally prominent T‐cell activation. (A) Representative flow cytometry plot showing subpopulations of PD‐1+ CD8+ TILs according to differential expression of PD‐1 and 4‐1BB. (B,C) Percentages of CD39+CD103+ cells (B) and CD38+HLA‐DR+ cells (C) among the PD‐1int, 4‐1BBnegPD‐1high, and 4‐1BBposPD‐1high subpopulations of total and NY‐ESO‐1157–specific CD8+ TILs. Left panels show representative flow cytometry plots (B,C). (D,E) RNA‐seq data comparing expression of genes related to T‐cell activation among FACS‐sorted PD‐1int, 4‐1BBnegPD‐1high and 4‐1BBposPD‐1high CD8+ TILs. (D) Heatmap showing expression levels of T‐cell activation gene signatures among the PD‐1int, 4‐1BBnegPD‐1high, and 4‐1BBposPD‐1high subpopulations. (E) Relative enrichment of T‐cell activation gene signatures among PD‐1int, 4‐1BBnegPD‐1high, and 4‐1BBposPD‐1high CD8+ TILs. Dashed line marks the significance threshold (P = 0.05). *P < 0.05; ***P < 0.001.
