Figure 4.

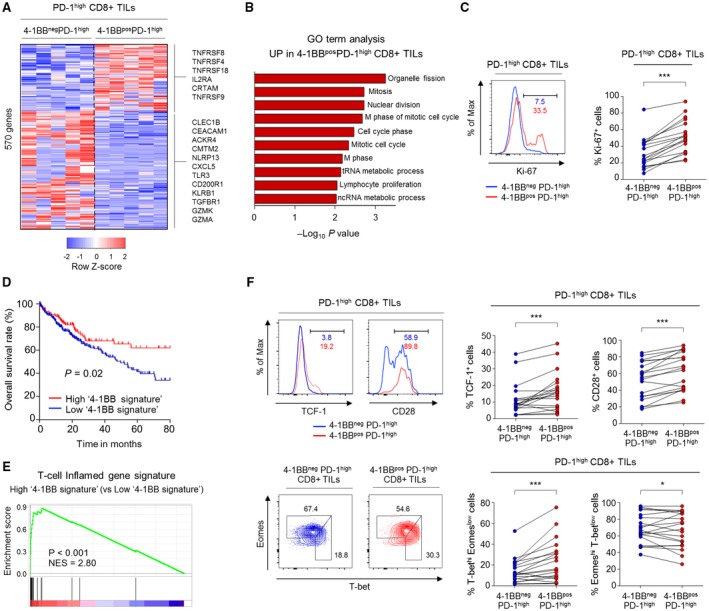
4‐1BBposPD‐1high CD8+ TILs exhibited higher levels of markers indicating T‐cell proliferation and reinvigoration compared to 4‐1BBnegPD‐1high CD8+ TILs. (A) Heatmap showing expression levels of 569 DEGs between 4‐1BBnegPD‐1high and 4‐1BBposPD‐1high CD8+ TILs. (B) Gene Ontology analysis for the DEGs that were up‐regulated in 4‐1BBposPD‐1high CD8+ TILs compared to in 4‐1BBnegPD‐1high CD8+ TILs. (C) Percentage of Ki‐67+ cells compared between 4‐1BBposPD‐1high and 4‐1BBnegPD‐1high CD8+ TILs. Left panel shows representative flow cytometry plot. (D) Kaplan‐Meier curve comparing survival outcomes among subgroups (i.e., high and low 4‐1BB signature groups) of HCC patients in the TCGA cohort, according to expression of the 4‐1BB signature. Cutoff was determined by the maximal chi‐square method. (E) GSEA was performed to compare the enrichment of a T‐cell–inflamed gene signature between the high and low 4‐1BB signature groups. (F) Expression levels of parameters involved in T‐cell reinvigoration (i.e., TCF‐1, CD28, and T‐bet/Eomes) were compared between 4‐1BBposPD‐1high and 4‐1BBnegPD‐1high CD8+ TILs. Left panel shows representative flow cytometry plots. *P < 0.05; ***P < 0.001. Abbreviations: ACKR4, atypical chemokine receptor 4; CEACAM1, carcinoembryonic antigen‐related cell adhesion molecule 1; CLEC1B, C‐type lectin domain family 1 member B; CMTM2, CKLF‐like MARVEL transmembrane domain‐containing 2; CXCL5, C‐X‐C motif chemokine ligand 5; Eomes, eomesodermin; GO, Gene Ontology; GZMA, granzyme 1, cytotoxic T‐lymphocyte–associated serine esterase 3; GZMK, granzyme K (serine protease, granzyme 3; tryptase II); IL2RA, interleukin‐2 receptor agonist; KLRB1, killer cell lectin‐like receptor B1; Max, maximum; ncRNA, noncoding RNA; NES, normalized enrichment score; NLRP13, NOD‐like receptor family pyrin domain containing 13; T‐bet, T‐box–containing protein expressed in T cells; TGFBR1, transforming growth factor beta receptor 1; tRNA, total RNA.
