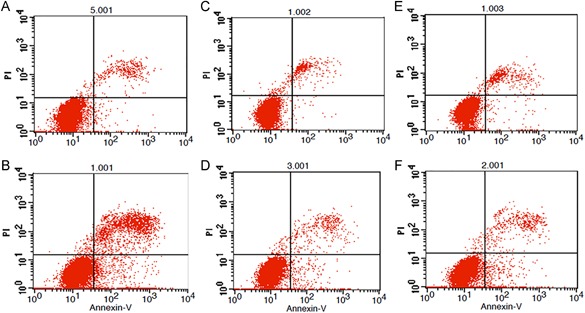
Figure 5.

Detection of apoptosis by flow cytometry. (A) Control group, (B) H2O2 positive control group, (C) 2 W/kg exposure group, (D) 2 W/kg sham‐exposure group, (E) 4 W/kg exposure group, (F) 4 W/kg sham‐exposure group. The apoptosis rate was evaluated by flow cytometry after Annexin V‐APC/PI staining. The upper left quadrants include the necrotic cells (AV−/PI+); the lower left quadrants include the viable cells (AV−/PI−); the upper right quadrants include the late apoptotic cells (AV+/PI+); and the lower right quadrants include the early apoptotic cells (AV+/PI−). Compared with the control group, the rate of total apoptosis in the H2O2 positive control group was significantly increased, but there were no significant changes in the other groups. H2O2 = hydrogen peroxide.
