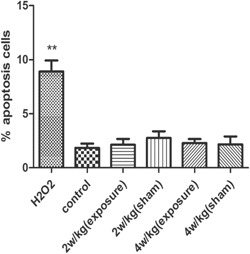
Figure 6.

The rate of cell apoptosis did not increase. Detection of cell apoptosis by flow cytometry was seen in the H2O2 group; **P < 0.01 compared with the control group, whereas there were no significant changes in the other groups; P > 0.05 compared with the control group. The percentage of apoptotic cells was represented as the mean ± SEM of three independent experiments. H2O2 = hydrogen peroxide; SEM = standard error of the mean.
