
Figure 4.
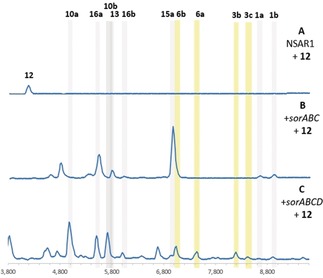
LCMS analysis (DAD 210–600 nm) of A. oryzae NSAR1 (A; control) and transformants expressing sorABC (B) or sorABCD (C) fed with scytolide (12). Dimeric sorbicillinoids are highlighted in yellow; monomeric sorbicillinoids are highlighted in grey.