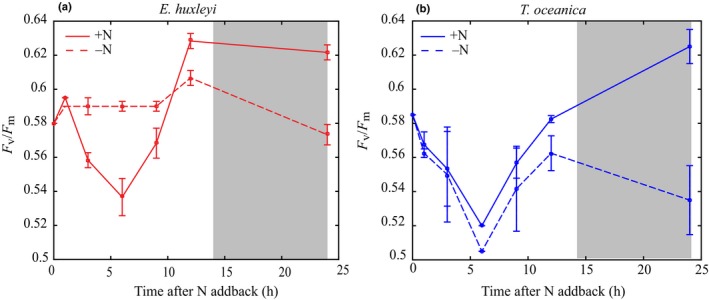
Figure 4.

F v/F m after NO3 − add‐back for Emiliania huxleyi (a) and Thalassiosira oceanica (b). Solid lines indicate the NO3 − add‐back treatment (+N). Dashed lines represent the control treatment (−N). Grey shading indicates the dark period (14 h : 10 h, light : dark cycle). Error bars represent ± SD.
