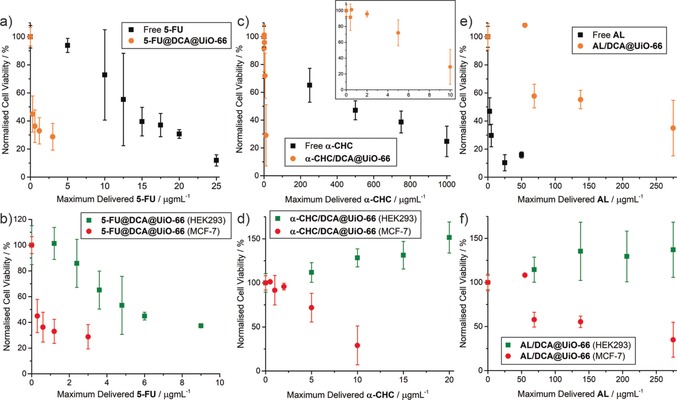
Figure 3.

MTS proliferation assays of the dual‐loaded MOFs towards MCF‐7 cancer cells and HEK293 kidney cells compared to the free drug. Values are normalised to the maximum possible dose of the most cytotoxic drug. a) Comparison of MCF‐7 cytotoxicity of 5‐FU@DCA@UiO‐66 with free 5‐FU. b) Comparison of cytotoxicity of 5‐FU@DCA@UiO‐66 towards MCF‐7 vs. HEK293. c) Comparison of MCF‐7 cytotoxicity of α‐CHC/DCA@UiO‐66 with free α‐CHC. d) Comparison of cytotoxicity of α‐CHC/DCA@UiO‐66 towards MCF‐7 vs. HEK293. e) Comparison of MCF‐7 cytotoxicity of AL/DCA@UiO‐66 with free AL. f) Comparison of cytotoxicity of AL/DCA@UiO‐66 towards MCF‐7 vs. HEK293. Error bars represent the standard deviation of the mean value of three independent assays.
