
Figure 4.
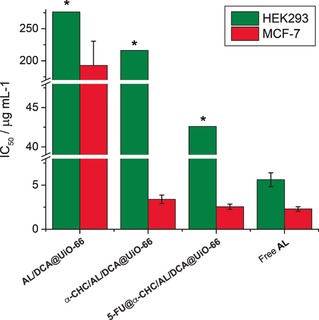
Comparison of IC50 values, normalised to AL, for various formulations against HEK293 and MCF‐7 cells. Measurements marked with an asterix (*) represent the maximum concentration assessed where cell proliferation remained >90 % and so IC50 values (and error bars) cannot be calculated. In all formulations, selectivity of anticancer cytotoxicity is enhanced when AL is incorporated in UiO‐66.