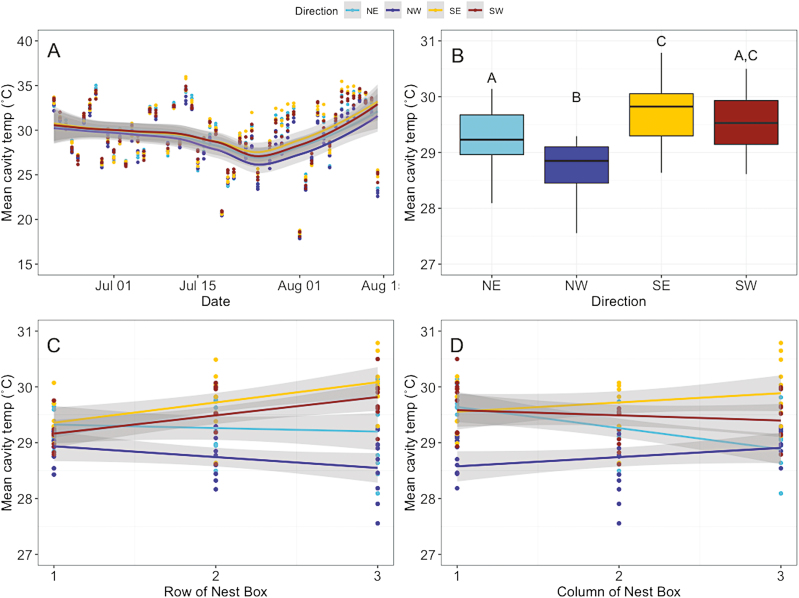
Fig. 2.
Average cavity temperature during foraging hours was influenced by multiple factors. (A) Cavity temperature averaged by day and direction for each replicate. Lines represent a loess fit. (B) Cavity temperature averaged by block and grouped by direction the cavity faced. (C) Average cavity temperature by row, with 1 being the top row of the box and 3 being the bottom row. Lines represent linear fits from the single predictor of temperature, grouped by direction. (D) Average foraging temperature by column, with 1 denoting the left most column and 3 denoting the right most column. Lines represent linear fits from the single predictor of temperature, grouped by direction. In (B–D), temperatures were averaged across the field season by block of the nest box. Gray shading in all panels indicates the 95% confidence intervals.

