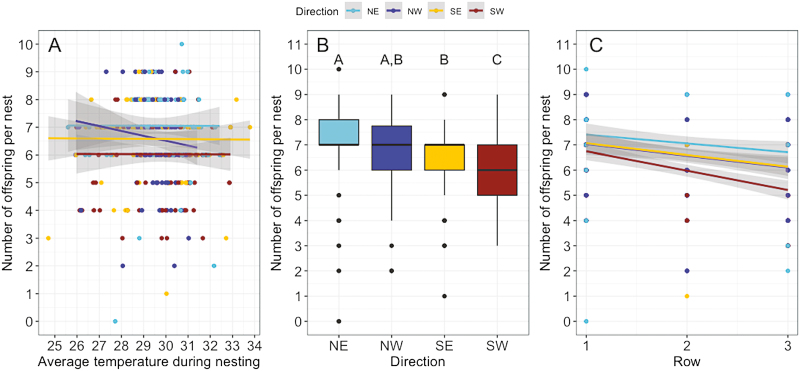
Fig. 5.
Nest size differs by direction the cavity faces and the row of the nest box. (A) Average cavity temperature during the nesting period did not affect nest size (P = 0.9967). Lines in (A) represent linear fits from the single predictor of temperature, grouped by direction. (B) Direction the cavity faced (P < 0.0001), and (C) row of the nest box (P < 0.0001) significantly influenced nest size. Lines in (C) represent linear fits from the single predictor of row, grouped by direction. Points correspond to individual nests. However, points overlap due to identical values. Gray shading in (A) and (C) indicates the 95% confidence intervals.

