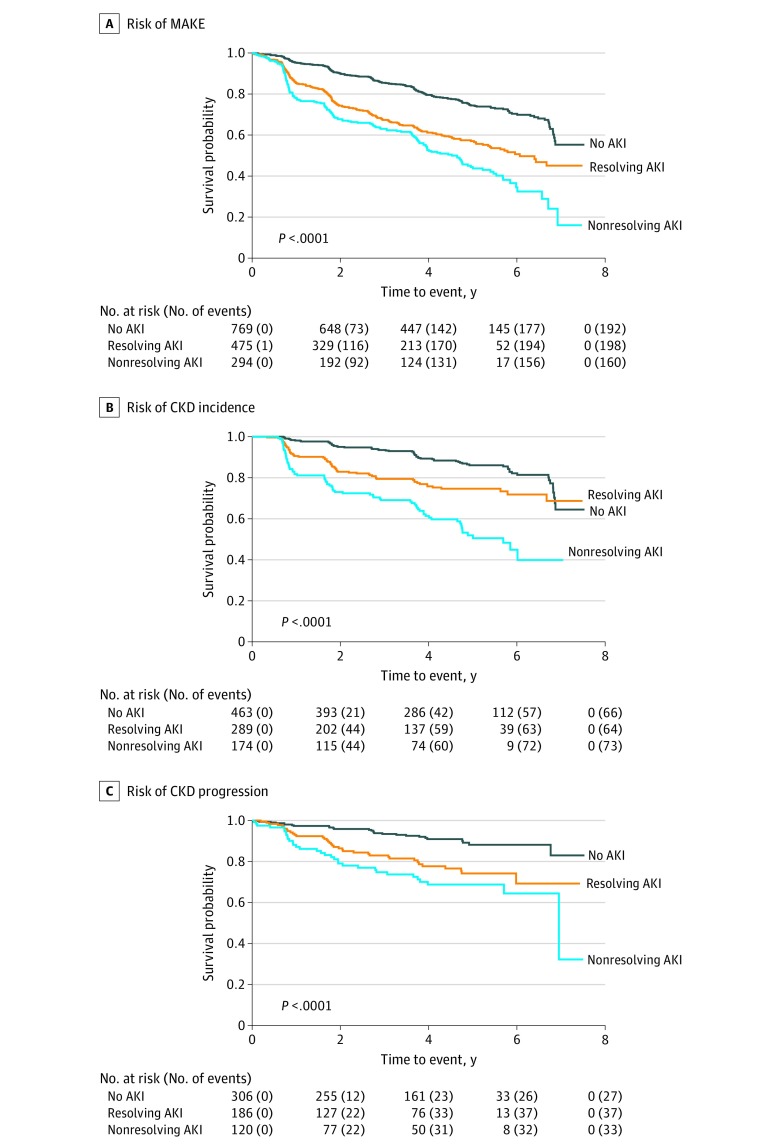
Figure. Risk of Renal Outcomes.
A, Kaplan-Meier plot demonstrates the highest risk for the composite outcome of major adverse kidney events (MAKE) among participants in the group with nonresolving acute kidney injury (AKI), with a stepwise decrease in the risk for MAKE in the group with resolving AKI, and then in participants without AKI. Major adverse kidney events are defined as the composite of chronic kidney disease (CKD) incidence, chronic kidney disease progression, initiation of long-term dialysis, or death from any cause during study follow-up. B, Risk of CKD incidence among patients without CKD at baseline. C, Risk of CKD progression among patients with CKD at baseline. The P value is a log-rank test of the null hypothesis that the survival distribution is the same across the no AKI, resolving AKI, and nonresolving AKI subgroups vs a significant difference in survival.

