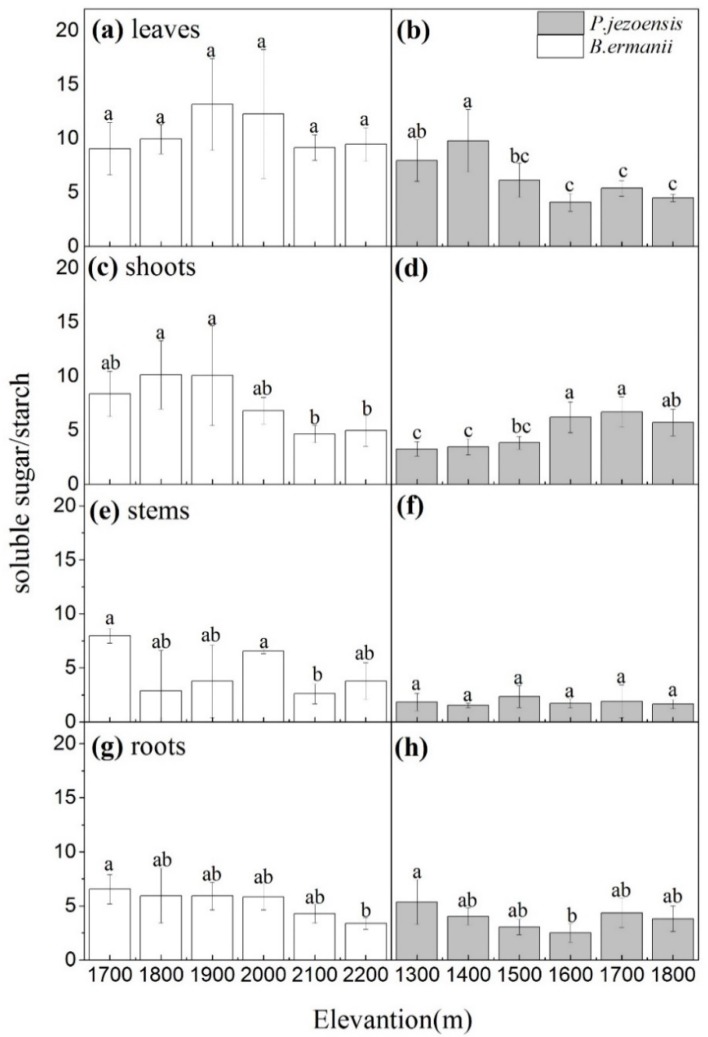
Figure 6.
The changes in the soluble sugars/starch ratio (mean ± SD) of B. ermanii (a) leaves, (c) shoots, (e) stems and (g) roots as well as P. jezoensis (b) leaves, (d) shoots, (f) stems and (h) roots along with elevational gradients in Changbai Mountain (n = 5 for each elevational site and tissue type). Different letters indicate significant differences (p < 0.05) among elevations as determined by Tukey’s HSD test single-factor ANOVAs.

