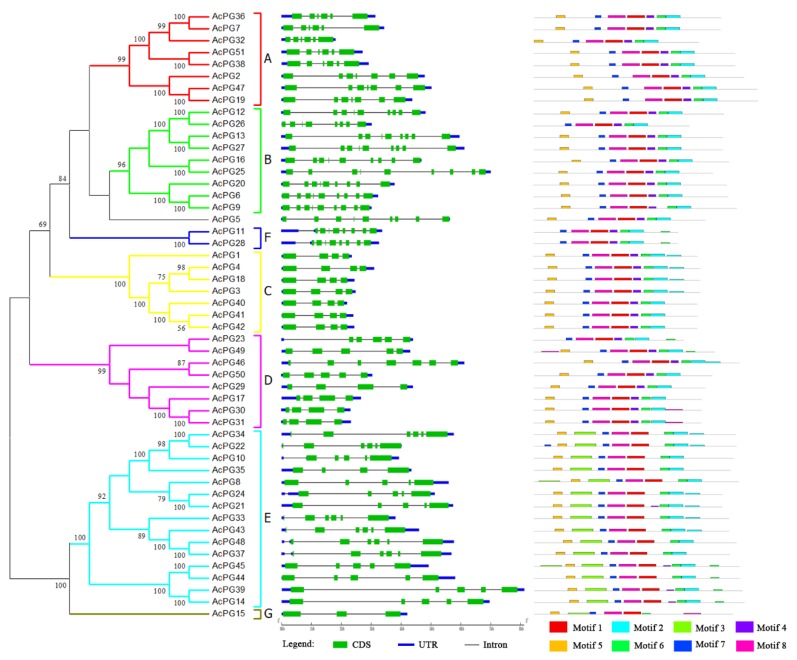
Figure 3.
Phylogenetic tree, genomic structure and conserved motif analysis of kiwifruit PG genes. The left illustrates the phylogenetic tree of kiwifruit PG genes constructed using MEGA 6.0 by the Neighbor-Joining method with the 51 full-length protein sequences of AcPGs. Numbers on branches indicate bootstrap percentage values calculated from 1000 replicates, and values lower than 50 are not shown. Seven clade (A to G) are distinctly formed in the phylogenetic tree. The middle represents the exon/intron genomic structure of AcPGs. CDS and UTR are indicated by green and blue boxes, respectively, and intron by black line. Their sizes can be estimated using the length scale at the bottom. The right indicates the composition and position of the conserved motifs of AcPGs. Eight conserved motifs identified by MEME are indicated by different colored boxed. The height of each box represents the conservation of each motif.

