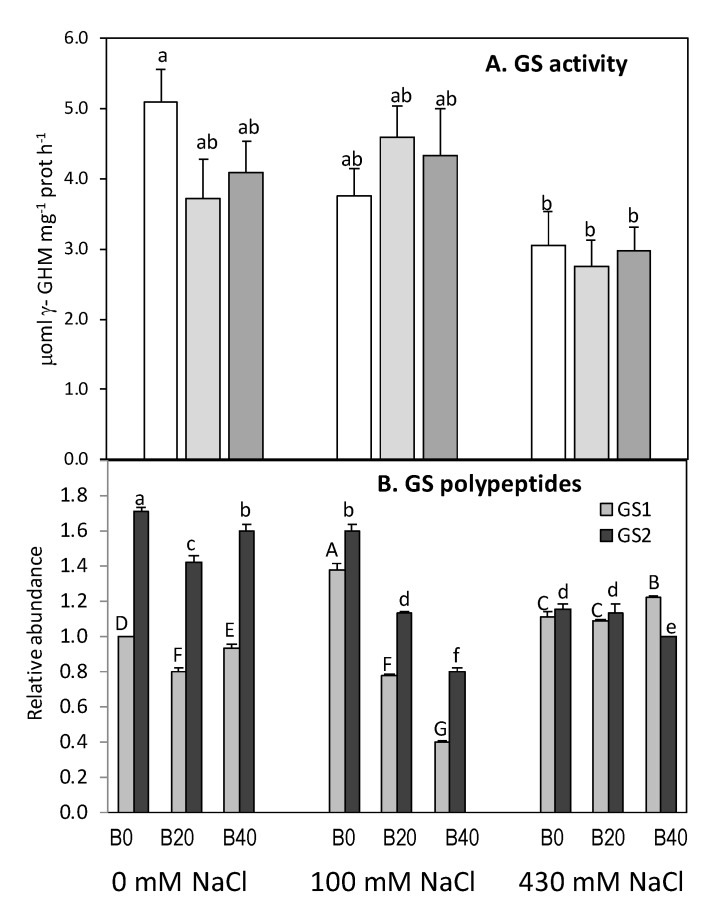
Figure 6.
Glutamine synthetase activity (A) and relative abundance of glutamine synthetase (GS) polypeptides (B) in leaves of Zea mays L. amylacea after 20 days of treatment with NaCl (0 mM; 100 mM; 430 mM) and H3BO3 (B0, control; B20, 20 mg kg−1; B40, 40 mg kg−1). The relative amounts of GS polypeptides were calculated following densitometric scanning of the Western blot and expressed as fold change in relation to the amount of GS1 (cytosolic GS polypeptide) in control plants (0 mM NaCl and B0). Similar protein content (20 mg) was loaded in each lane. Values represent the mean ± SE of three independent experiments. Bars with the same letter are not significantly different according to LSD at level of p < 0.05.

