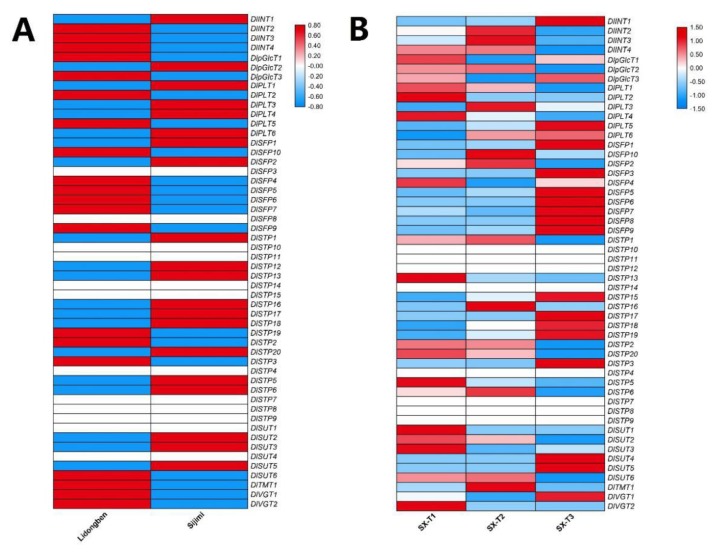
Figure 9.
Expression profiles of the DlSTs in different varieties and tissues. (A) The expression profile of the DlST genes in ‘Lidongben’ and ‘Sijimi’. (B) The expression profile of the DlST genes in different floral bud development stages in ‘Shixia’. SX-T1 represent stage before the emergence of floral primordia, SX-T2 represent stage of the appearance of red dot, and SX-T3 represent stage of the appearance of the first inflorescence apical buds. The color scale represents the log2 (expression values + 1); the red and blue colors indicate the higher or lower expression level, respectively.

